![]()
The Big Game Indicator and Other Unusual Economic Theories
Submitted by JMB Financial Managers on January 26th, 2024
It’s a fun time of year for football fans. The NFL playoffs are starting, and the Big Game is just around the corner. While football fans will tune in for the match-ups, commercials, and Usher’s Big Game halftime show, you may not realize that a segment of viewers will be watching the game to glean clues about the potential direction of the financial markets. These investors are looking for a nonscientific phenomenon known as the “Big Game Indicator”.
We thought it would be interesting to explore this and a few other out-of-the-box pseudo indicators. Keep in mind that these theories may not materialize based on the outcome of the Big Game. And any investment should be consistent with your objectives, time frame, and risk tolerance.
What Is the Big Game Indicator?
The National Football League (NFL) has been around since 1920. In 1960, the rival American Football League (AFL) formed. After ten years of competing for fans, the two leagues merged under the NFL moniker in 1970.1
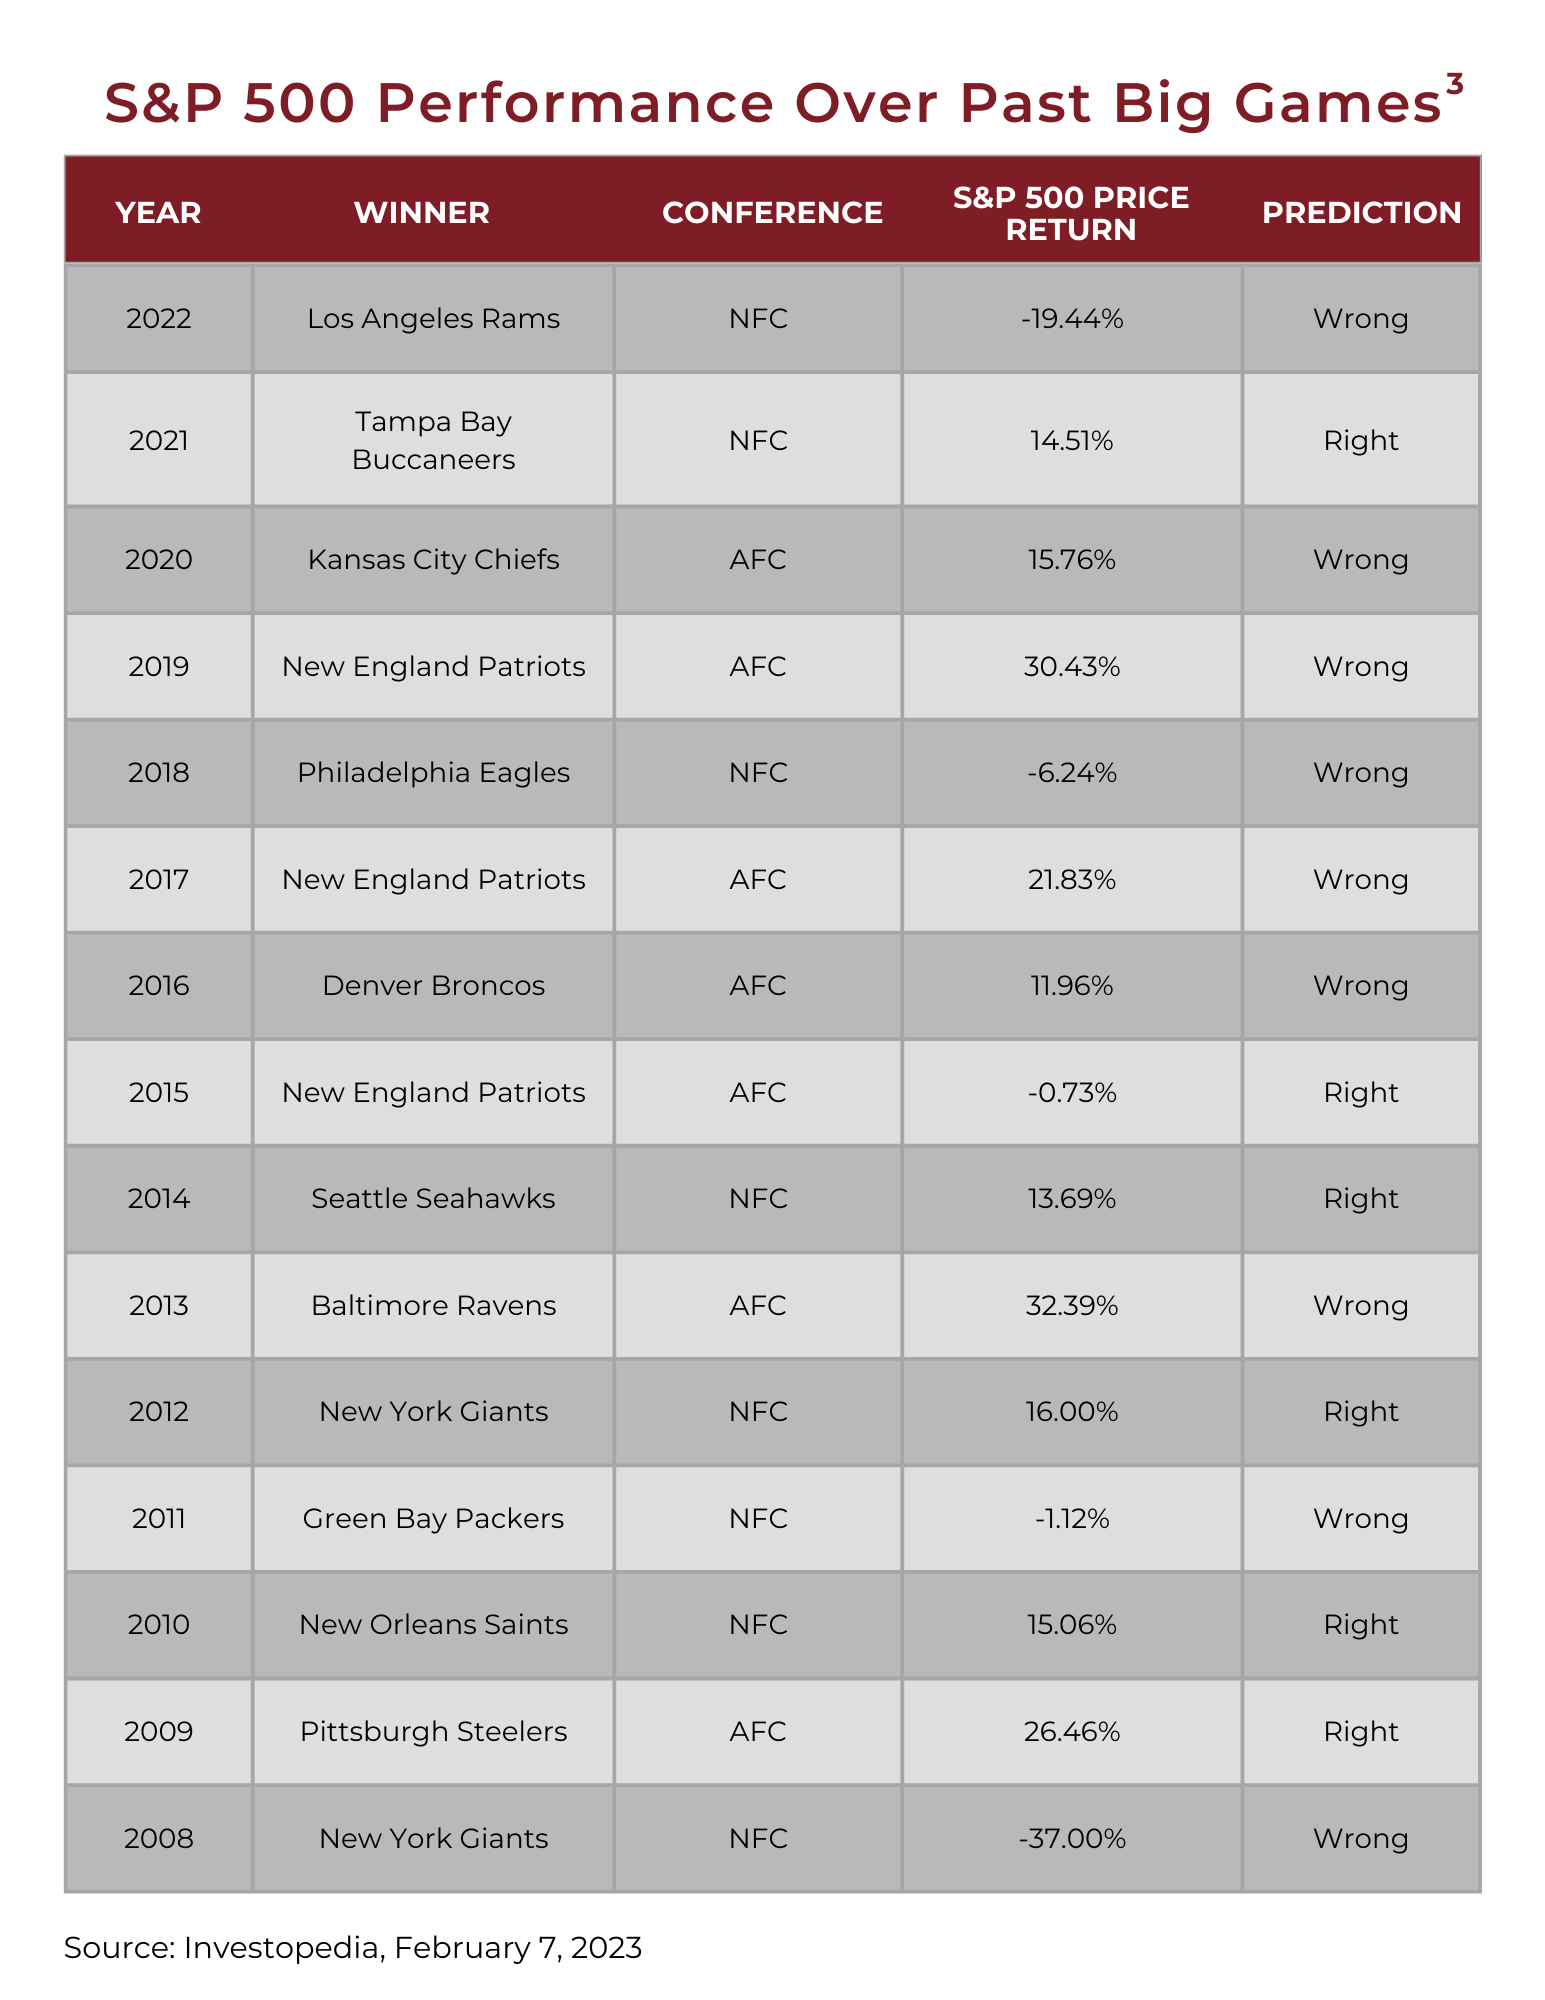
The Big Game Indicator is the theory that if a pre-merger NFL team wins, that can be a positive for the stock market, as measured by the Standard & Poor’s 500 Composite Index. However, if a former AFL team takes the Lombardi Trophy, that may foreshadow bearish conditions ahead.2
Although decidedly nonscientific, this indicator has somehow endured for decades among those who believe big game outcomes eerily align with market moves. Rather than to earnings, rates, and risks, these superstitious people might look to the results from Allegiant Stadium on February 11 as a predictive barometer.
Where Did the Big Game Indicator Come from?
The Big Game Indicator was introduced in 1978 by Leonard Koppett, a sportswriter for The New York Times. When he came up with it, his Big Game Indicator had never been wrong.
As prescient as it was up to that point, Koppett added one major caveat to his indicator that helped his odds. He put the Pittsburgh Steelers, a team with an NFL-leading six Big Game wins, in the NFC. His logic was that the team started back in 1933 as an original NFL franchise, even though it won all its Big Games as part of the AFC.3
How Has the Big Game Indicator Done at Predicting Stock Market Returns?
Overall, the results of the Big Game Indicator have had a slightly better-than-average track record. Since its introduction in 1978, the Indicator has been right roughly 70 percent of the time.3
But, as the chart below indicates, Koppett’s theory hasn’t had such a stellar record since 2008. It seems the Big Game didn’t predict major world events like the Great Recession or the COVID-19 pandemic.
There Are Plenty of Other Strange Indicators Out There
Besides the Big Game Indicator, there are several other quirky indicators that certain people have followed over the years.
The Cardboard Box Indicator
The Cardboard Box Indicator is based on the fact that nearly everything is shipped in a cardboard box. This indicator points to the strength of the economy. High demand for cardboard boxes means more economic activity is happening. Just think of all those Amazon boxes outside your door.
Less demand for cardboard indicates a less robust economy. Rumor has it that famed Federal Reserve Chairman Alan Greenspan may have glanced at this indicator to gain insight into manufacturing performance.
Cardboard box watchers point out that in 2008, at the height of the recession, revenue of cardboard box manufacturers averaged a 50% drop.4
The Big Mac Index
The Big Mac Index compares the cost of a McDonald’s Big Mac in over 50 countries. The theory operates on the premise that the same item should cost essentially the same everywhere.
As a result, if you compare the price of a Big Mac using exchange rates, you can see if a country’s currency may be overvalued or undervalued. The Economist first developed the Big Mac Index in 1986 and maintains an interactive index on their website.4
The Christmas Price Index
Many indices measure inflation rates, but one of the most unusual is the Christmas Price Index. Created by PNC Bank, it focuses on the items found in the lyrics of “The Twelve Days of Christmas.”
PNC traditionally goes to Petco for the price of canaries (calling birds), Gordon’s Jewelers for golden rings, and the Cincinnati Zoo for rates on partridges, turtle doves, and French hens. The index has revealed interesting trends over the years, including fluctuations in labor prices.5
All the companies mentioned are for illustrative purposes only. It should not be considered a solicitation for the purchase or sale of securities.
Taking a Long-Term Perspective
As financial professionals, we are here to help our clients build portfolio strategies based on their goals, time horizons, and risk tolerance. We focus on creating a sound financial approach and avoid being influenced by superstitious theories.
Our job is to create roadmaps that help our clients pursue their short-term and long-term objectives. So enjoy the big game, but avoid reading anything into the final score!
References
- Britannica.com, October 28, 2023 https://www.britannica.com/topic/National-Football-League
- The Chicago Financial Planner, February 7, 2023. The S&P 500 Composite Index is an unmanaged index that is considered representative of the overall U.S. stock market. Index performance is not indicative of the past performance of a particular investment. Past performance does not guarantee future results. Individuals cannot invest directly in an index. The return and principal value of stock prices will fluctuate as market conditions change. And shares, when sold, may be worth more or less than their original cost. https://thechicagofinancialplanner.com/the-super-bowl-and-your-investments/
- Investopedia, February 7, 2023 https://www.investopedia.com/terms/s/superbowlindicator.asp#toc-what-is-the-super-bowl-indicator
- The College Investor June 19, 2023 https://thecollegeinvestor.com/1666/weird-stock-market-indicators/
- PNC.com, November 14, 2023 https://www.pnc.com/en/about-pnc/topics/pnc-christmas-price-index.html
--
About the Author

Jack Brkich III, is the president and founder of JMB Financial Managers. A CERTIFIED FINANCIAL PLANNER TM, Jack is a trusted advisor and resource for business owners, individuals, and families. His advice about wealth creation and preservation techniques have appeared in publications including The Los Angeles Times, NASDAQ, Investopedia, and The Wall Street Journal. To learn more visit https://www.jmbfinmgrs.com/.
Connect with Jack on LinkedIn or follow him on Twitter.
JMB Financial Managers Mid-Year Review for 2025
Click the button below to download a pdf of insights and predictions for the rest of the year.